Plotting math equations using Swift Charts
Discover how to plot math equations using Swift Charts in a SwiftUI app.

The tutorial Using Swift Charts in a SwiftUI app shows how to represent data in different forms of visualization with just a few lines of code. Since this WWDC24 the Swift Charts framework also supports mathematical equation plotting introducing two new charts components, LinePlot and AreaPlot.
The first is used to draw the equation on the chart while the second is used to visualize the area under the plotted equation.
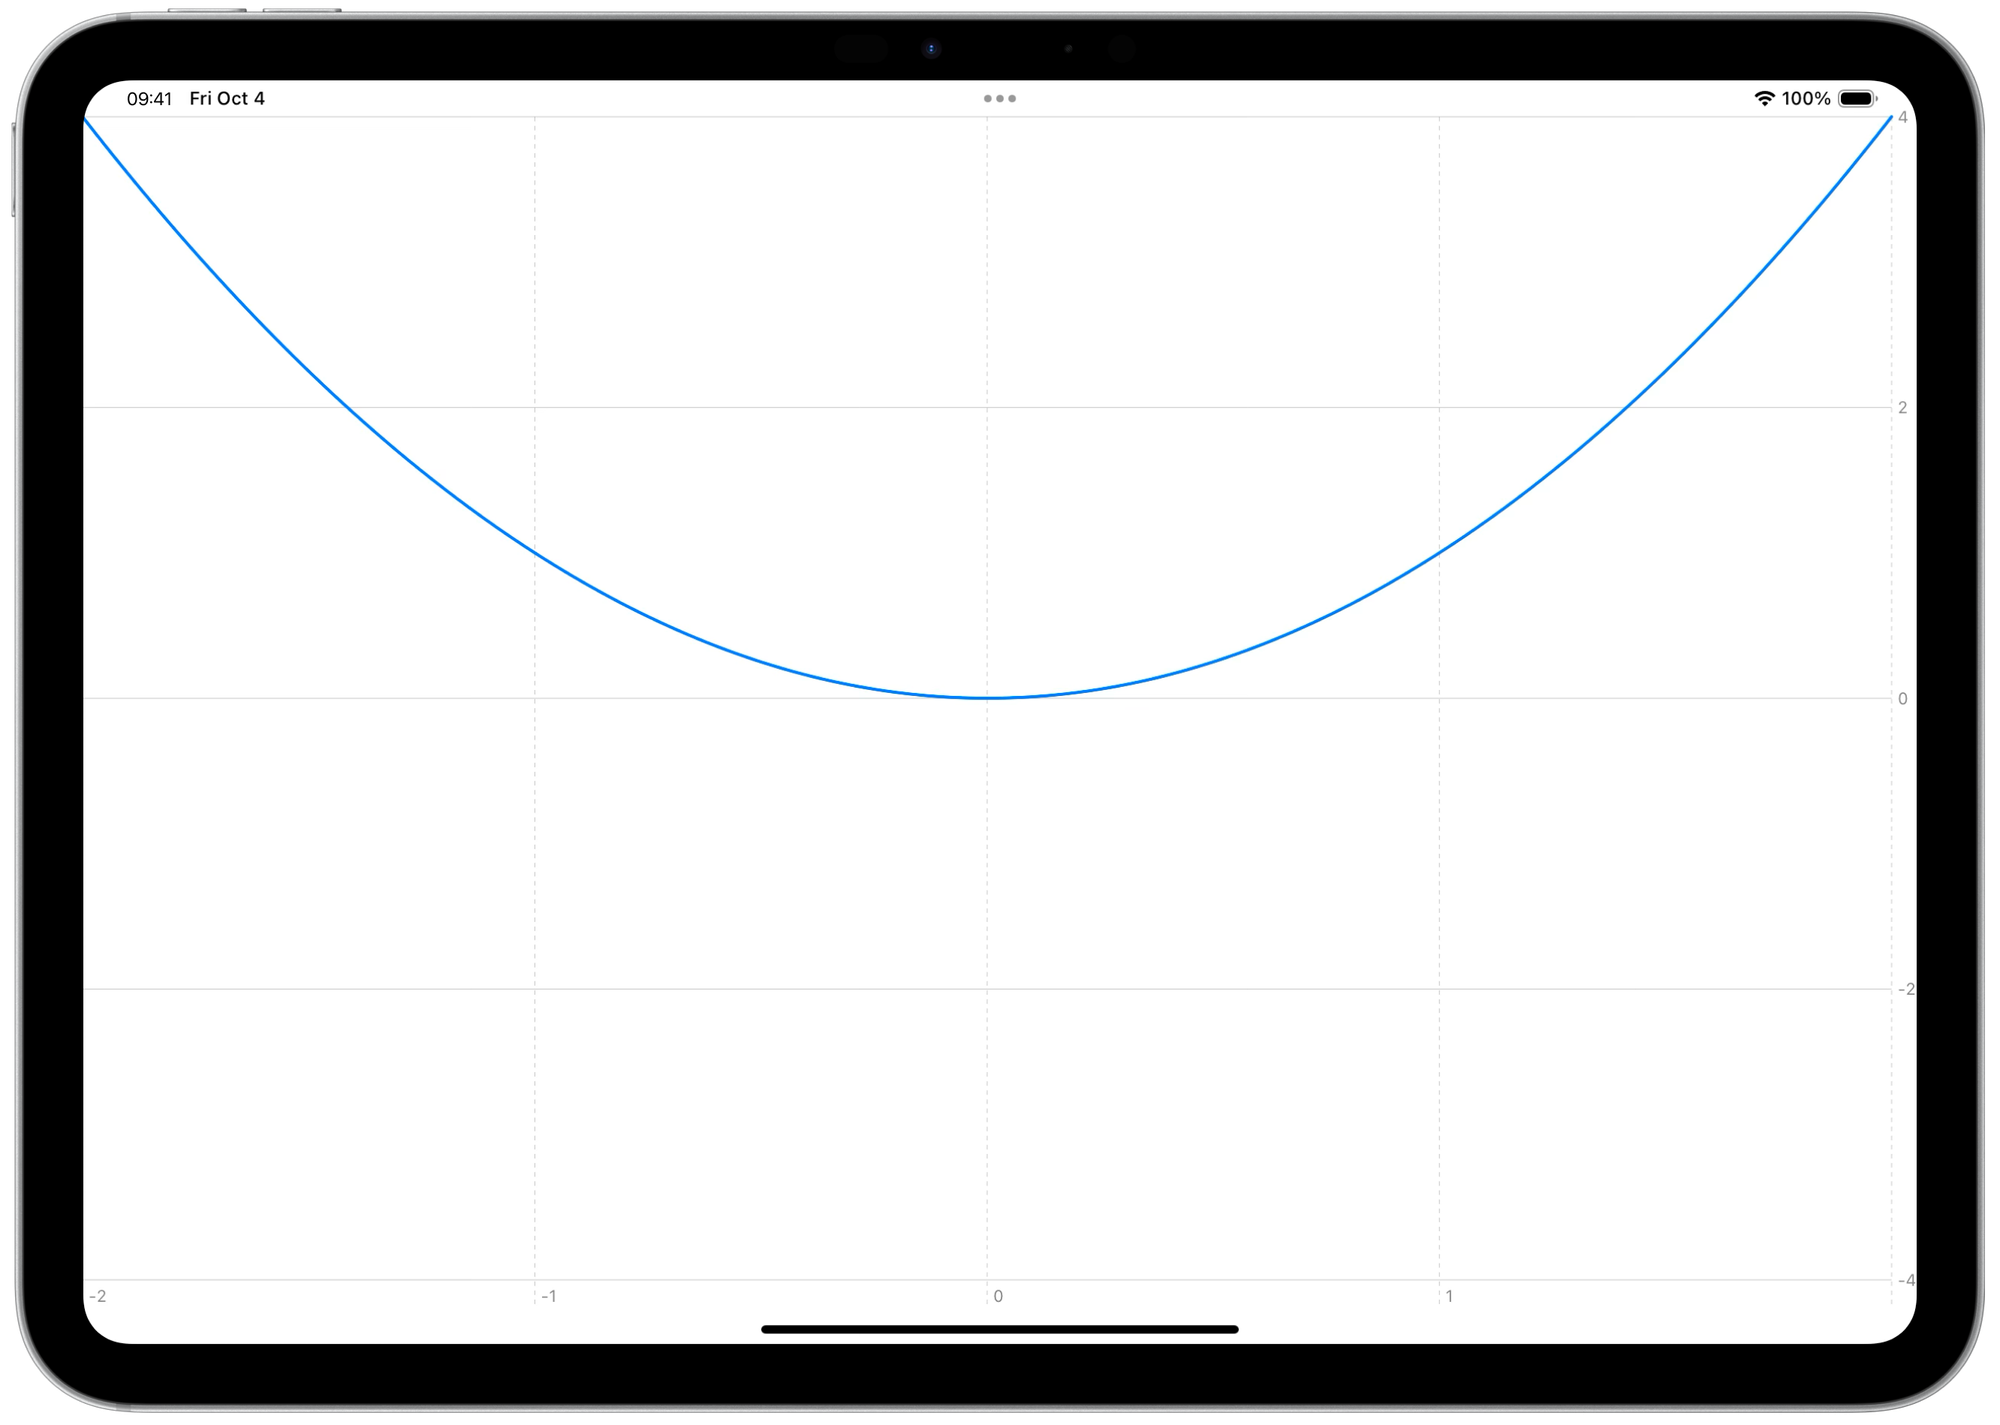
Let’s start by plotting a simple equation as:
For that, we can use a built-in function to perform arithmetic operations such as pow(_:_:).
import SwiftUI
import Charts

struct ContentView: View {

    var body: some View {
        Chart {
            LinePlot(x: "x", y: "x^2") { x in
                pow(x,2)
            }
            .foregroundStyle(.blue)
        }
        .chartXScale(domain: -2 ... 2)
        .chartYScale(domain: -4 ... 4)
    }

}
Using the chartXScale(domain:type:) modifier we can also constrain the chart in a specific range of values, which in math is defined as limiting the domain of a function.
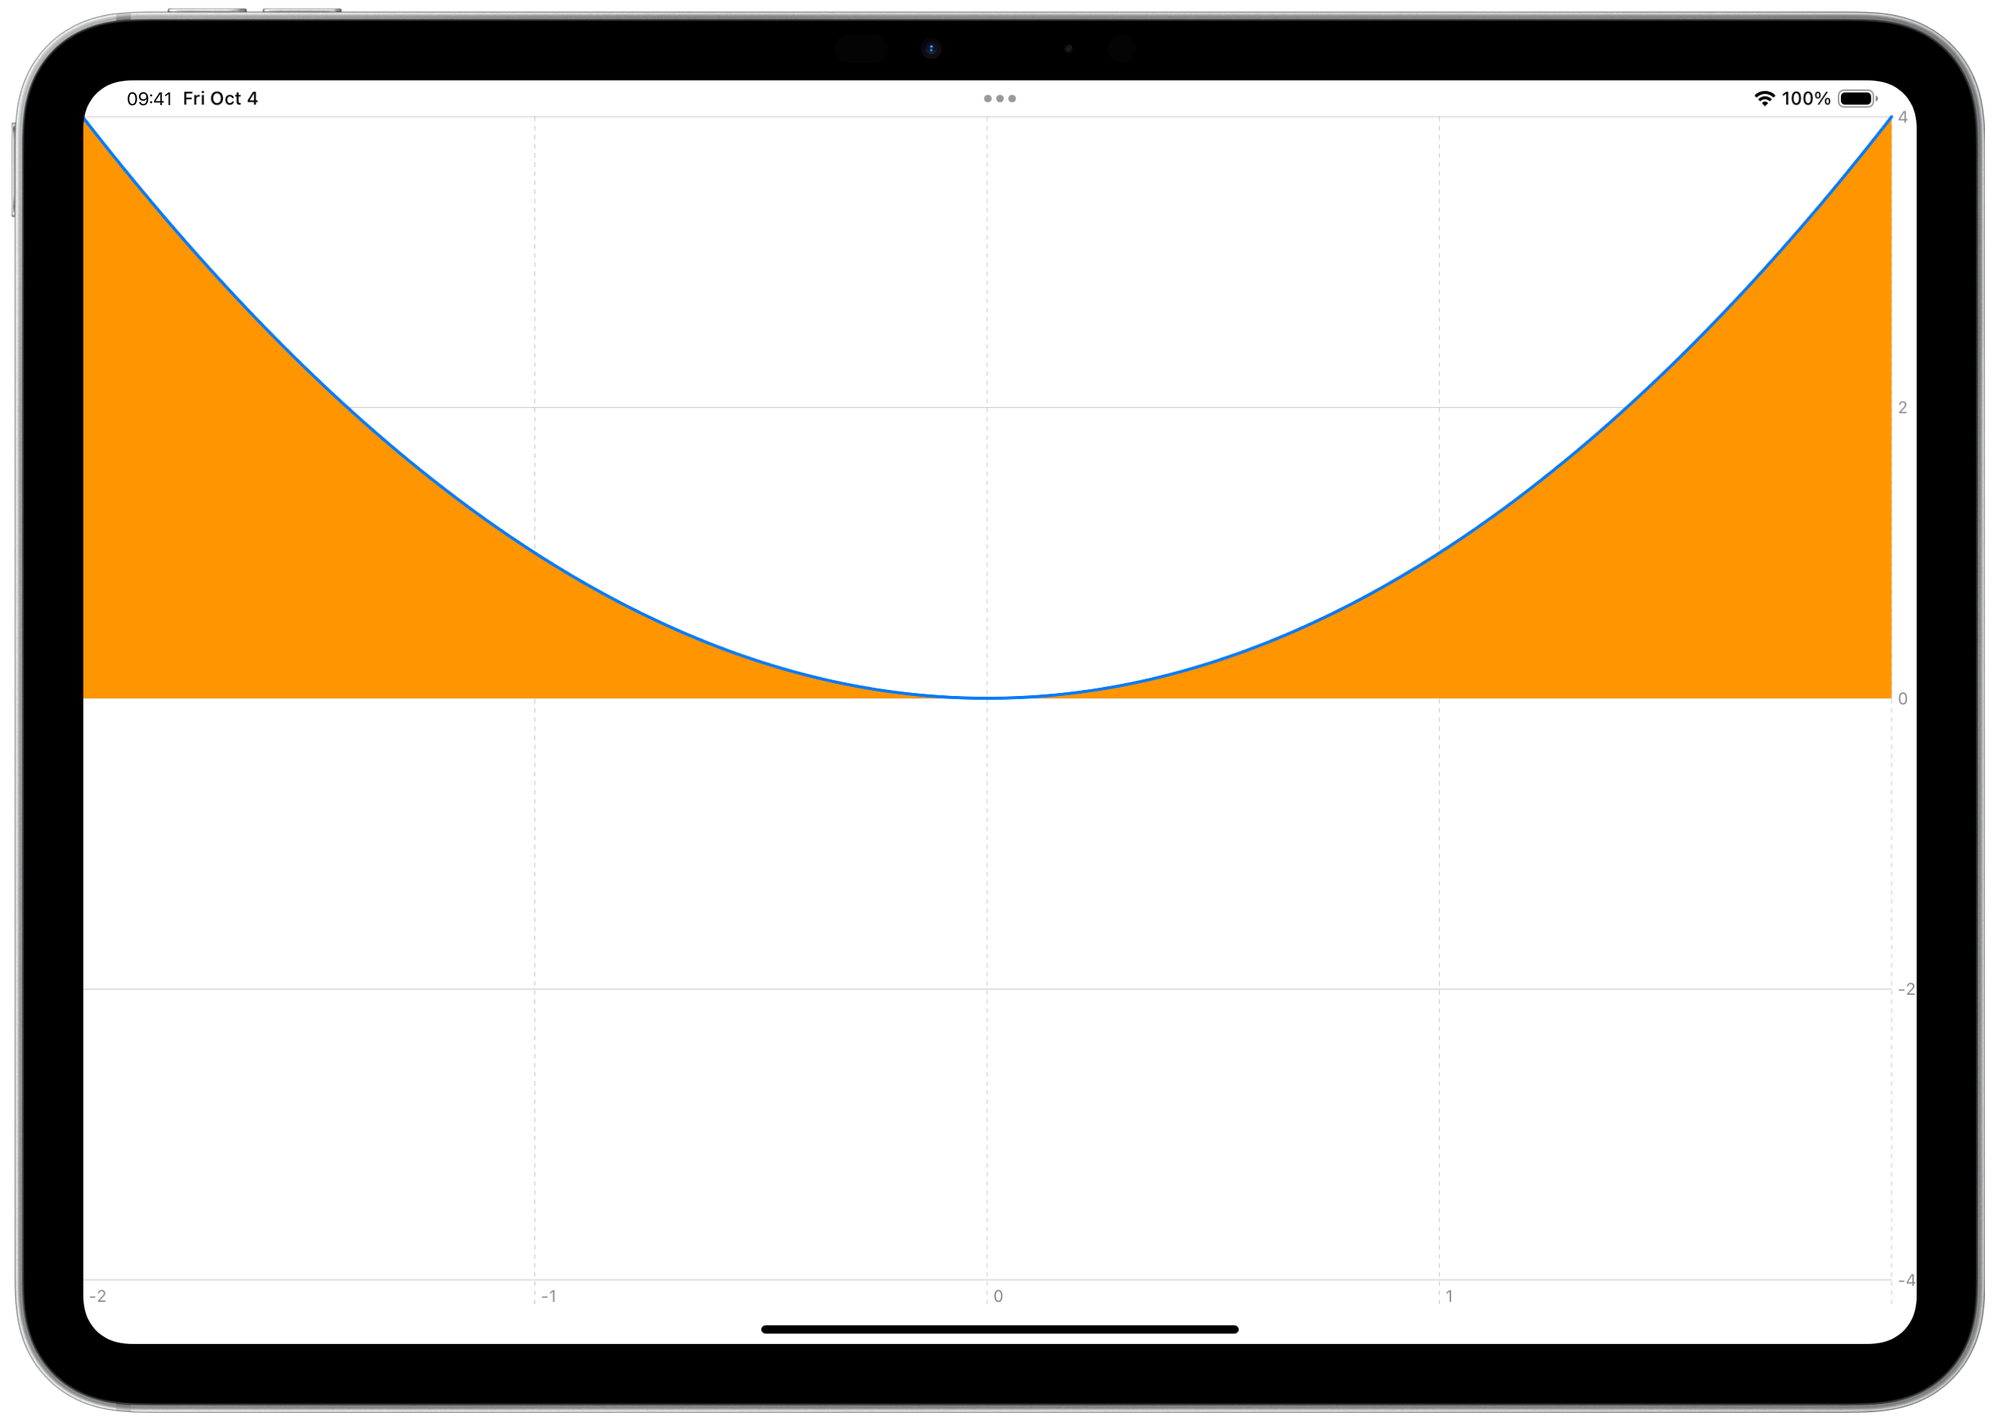
It is possible to visualize the area of the space under the equation by using the AreaPlot object in the same chart container.
import SwiftUI
import Charts

struct ContentView: View {

    var body: some View {
        Chart {
            AreaPlot(x: "x", y: "x^2") { x in
                pow(x, 2)
            }
            .foregroundStyle(.orange)

            LinePlot(x: "x", y: "x^2") { x in
                pow(x,2)
            }
            .foregroundStyle(.blue)
        }
        .chartXScale(domain: -2 ... 2)
        .chartYScale(domain: -4 ... 4)

    }
}
Parametric equation
Swift charts now also support parametric equations that help us plot complex charts as spirals. A parametric equation allows us to plot a set of equations where the values are expressed as functions of one parameter like:
We can easily do that within the LinePlot component, like in the example below:
import SwiftUI
import Charts

struct ContentView: View {

    @State var point = 2.0

    var body: some View {

        VStack {
            Chart {
                LinePlot(x: "x", y: "y", t: "t", domain: 0 ... point) { t in
                    let x = t * cos(t)
                    let y = t * sin(t)

                    return(x,y)
                }
            }
            .chartXScale(domain: -100 ... 100)
            .chartYScale(domain: -100 ... 100)

            Slider(value: $point, in: 0...100)
        }
    }

}Thanks to the new addition to the Swift Chart framework we are able to represent a wider type of data that can be crucial in specific applications such as audio visualization, economy, or physics. And from an educational perspective, this allows developers to make math more understandable for everyone.